If you arrive at this page looking for the official London Solar Opportunity Map, then please follow this link instead: https://maps.london.gov.uk/lsom/. The following discussion provides a brief overview of the visualisation and is not intended as an official portal to the webpage.
London Solar Opportunity Interactive Dashboard
 London Solar Opportunity Map
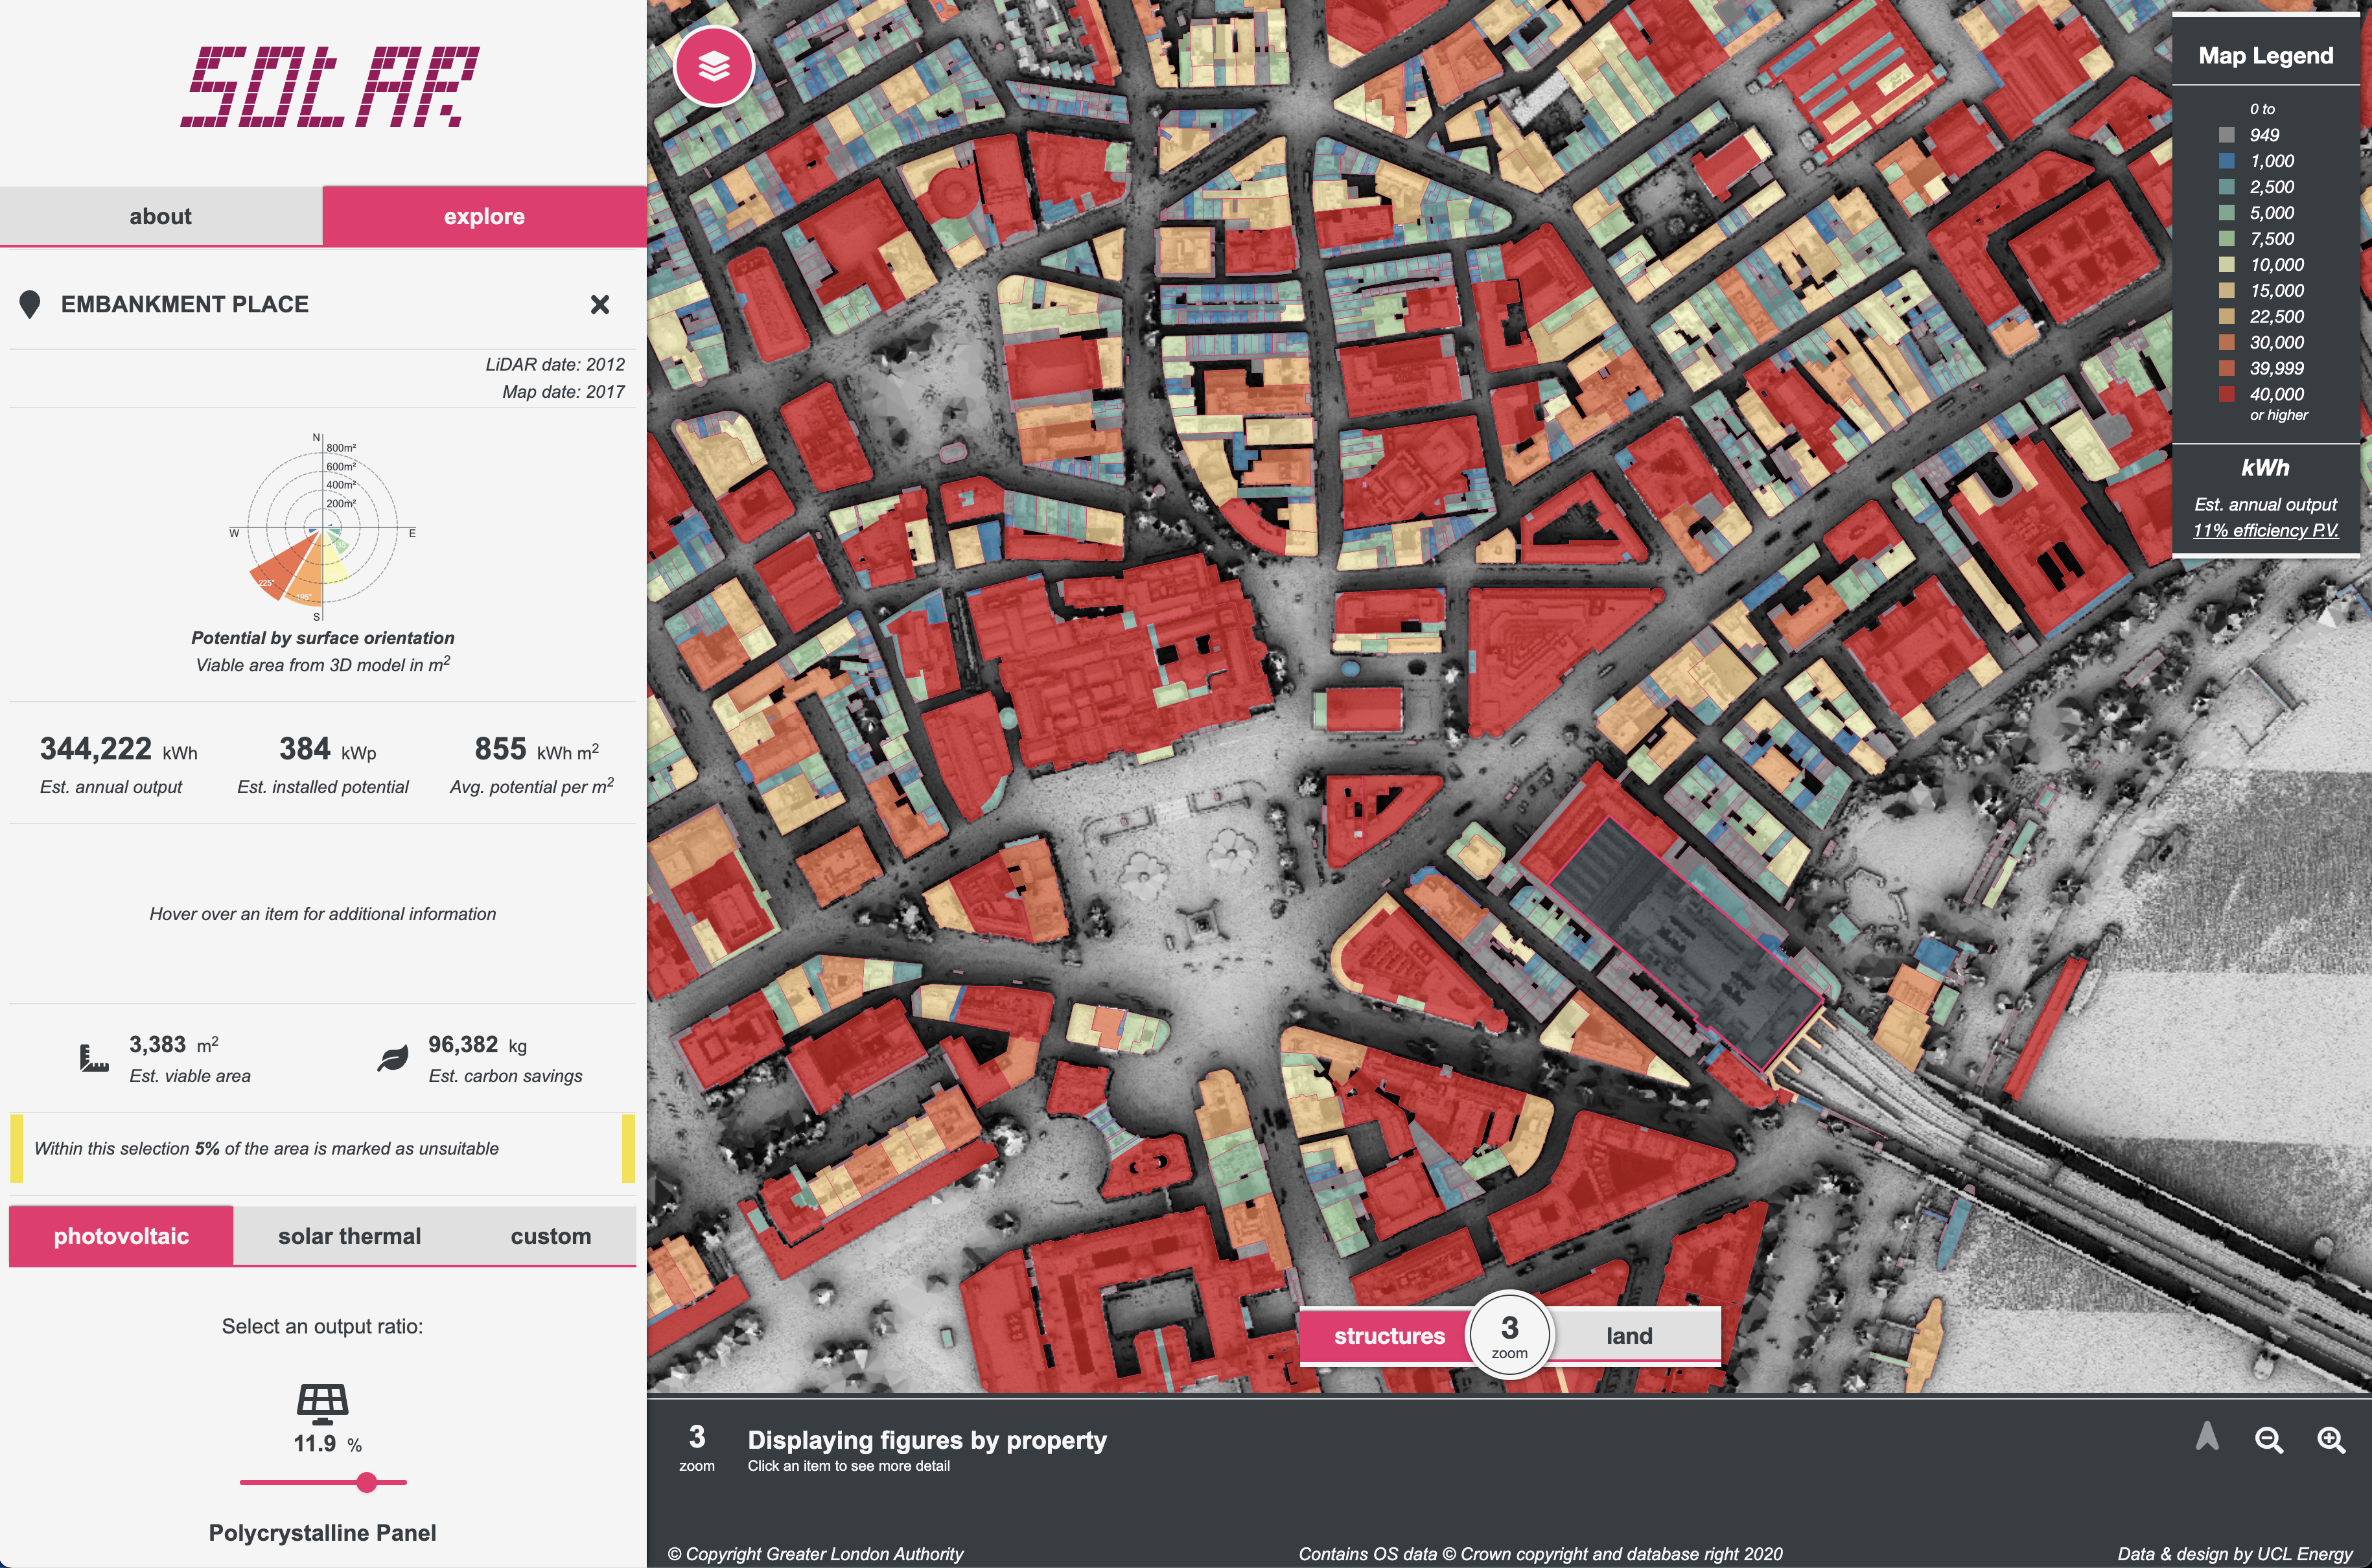
The Building Stock Lab at the UCL Energy Institute is doing some incredible research tying-together national-scale datasets to develop meaningful insights into the building stock and its relation to energy-use and related retrofits for net-zero targets. As part of this work, they do some interesting analysis using LiDAR data to develop an understanding of Solar Opportunities for the building stock, and have developed this dataset and associated dashboard visualisation with coverage for the City of London.
In my role I contributed to the user interface which ties together a mapbox-gl / vue / D3 stack. An interactive solar energy selector lets the user pick a source and the estimated energy output and carbon savings are then projected on-the-fly.
Something neat is the lab’s raster-map of the LiDAR data (via the associated button), and the dynamic “solar” font is kind of fun, too.
Head-on over to https://maps.london.gov.uk/lsom/ to learn more about the data.