Visualising trips on the Underground
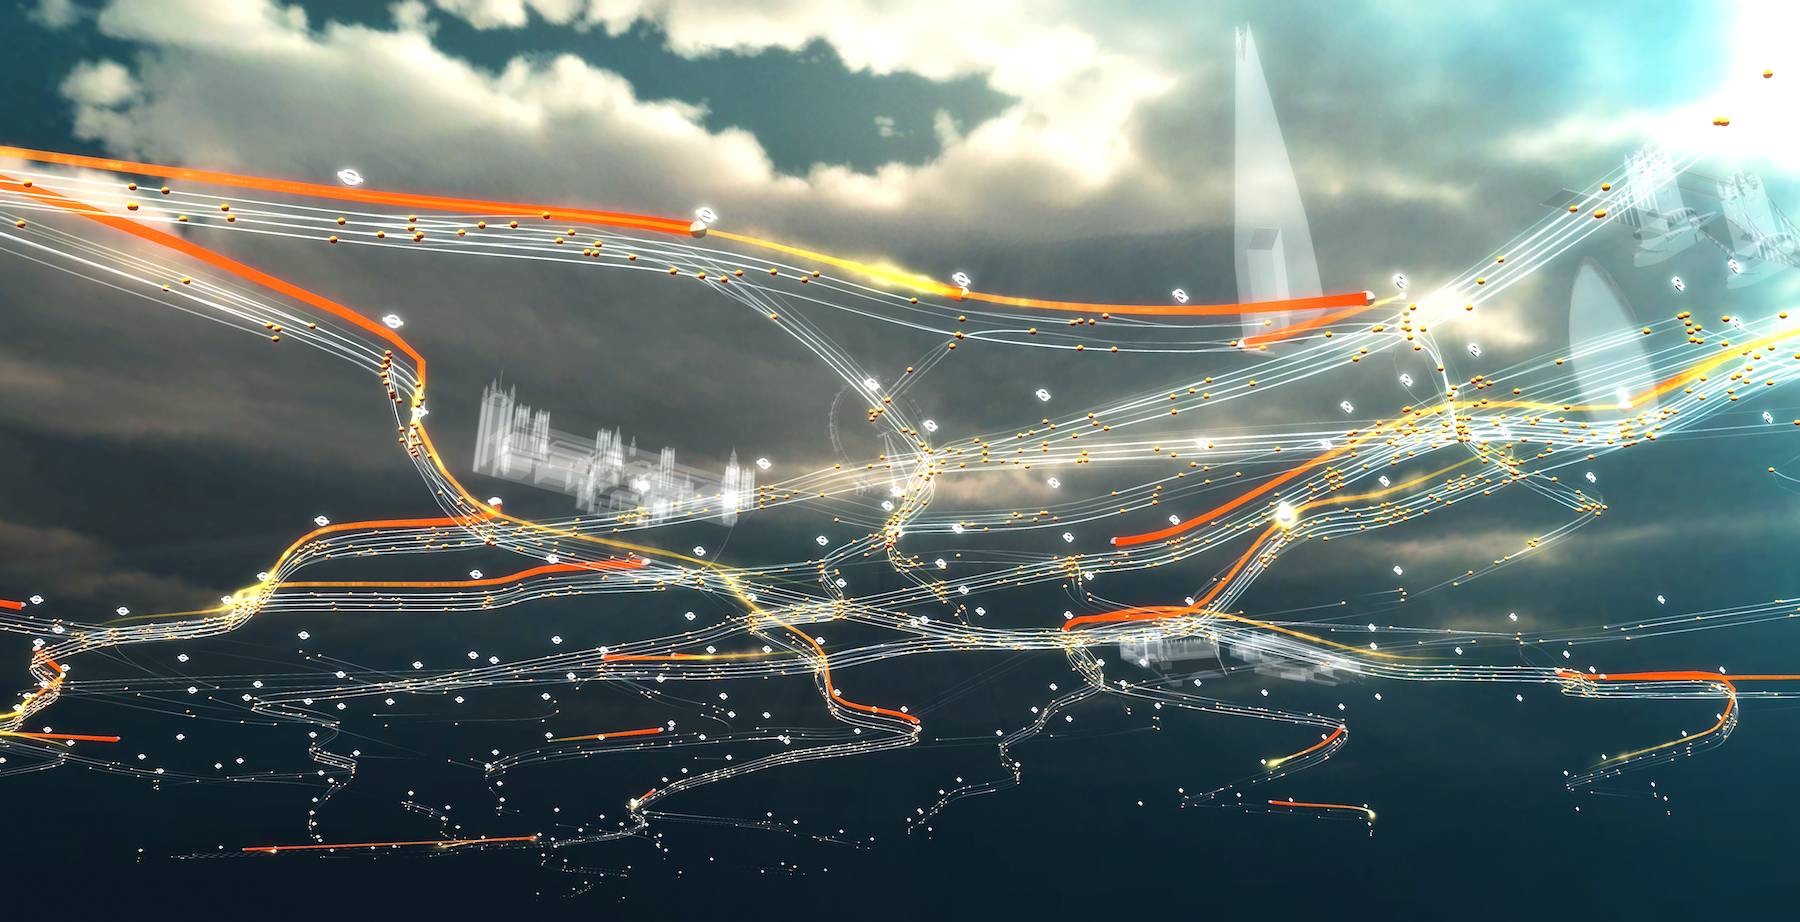
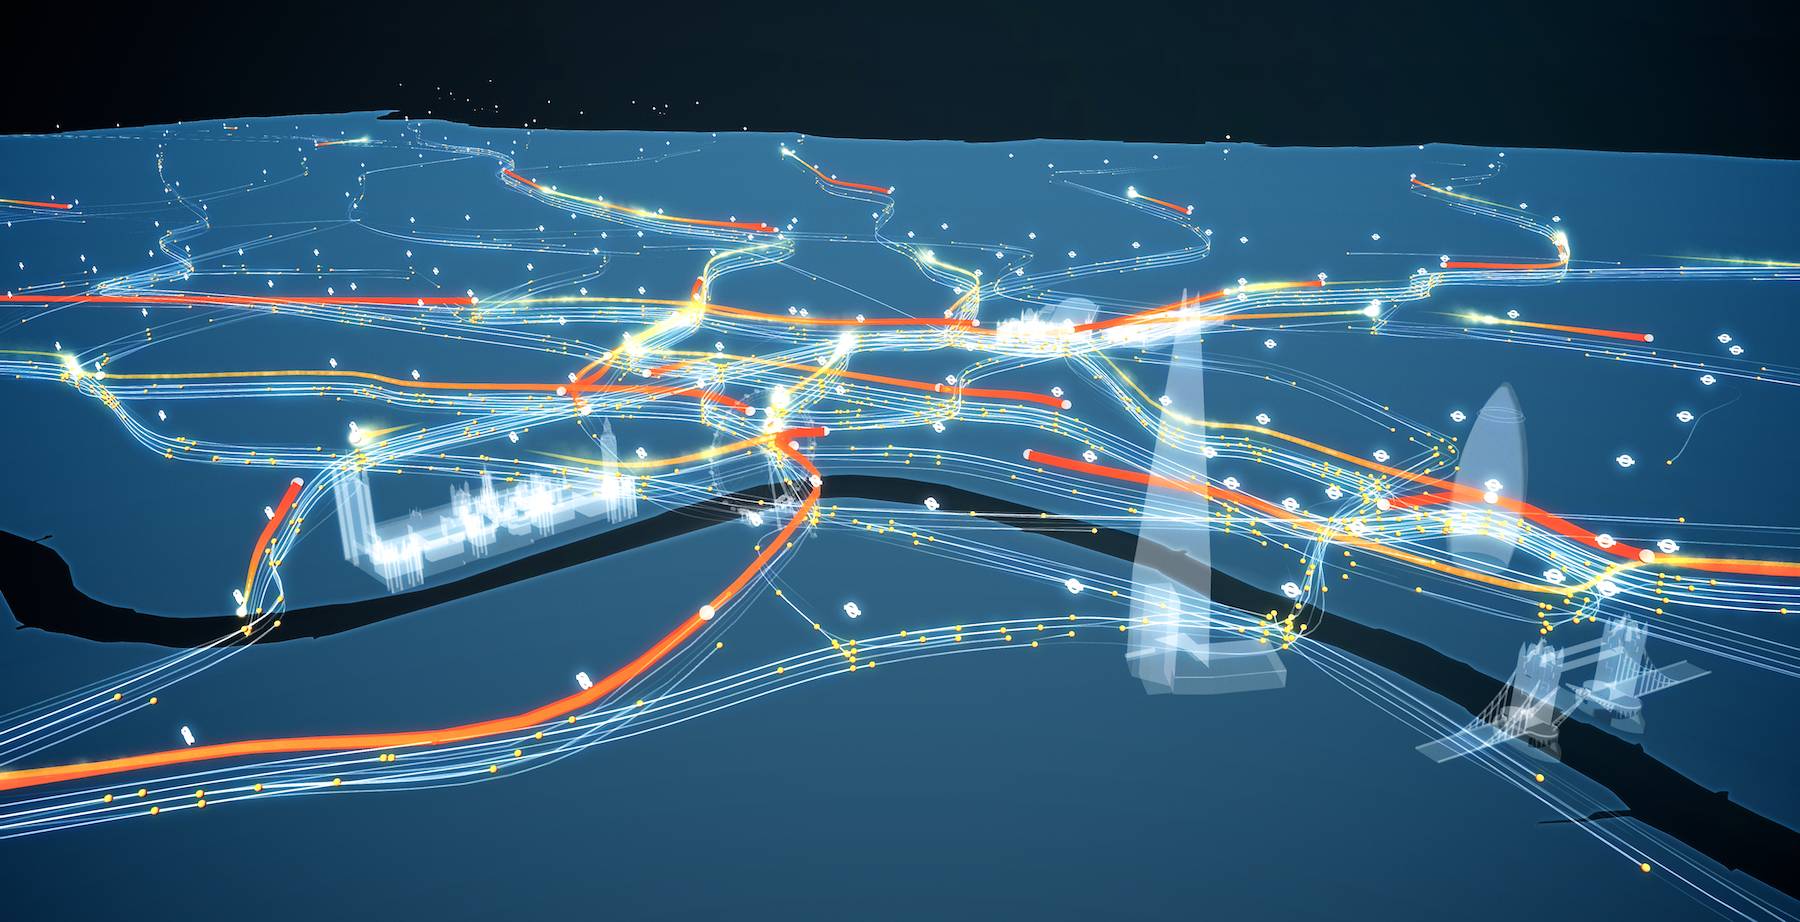
This video is a follow-up to my earlier post. It is the completed visualisation of Disabled Freedom Pass trips on the London Underground network. The bright orange lines represent the Disabled Freedom Pass (DFP) trips, whereas the white lines represent all other oyster card users. In the hands-on application version, the user can navigate the scene in realtime with the mouse and arrow keys, and click on any station to see only the trips to and from that particular location.
In a nutshell, the data preparation was done in Python, where individual trips were solved using a shortest path algorithm to identify the likely waypoints for each tube trip. The data, over 700,000 trips worth, was then exported as a CSV file which is used in the Unity app to create the scene and animate the trips.
I remain quite impressed with Unity’s speed and flexibility - it actively handles over 3,500 animated objects on-the-fly. As such, its a very potent framework for developing dynamic and interactive visualisations.
Data Prep
The data is based on a 5% sample from November 2009, provided by Transport For London. The data preparation was done in Python and took some geospatial inputs which had originally been prepared from the TFL data by fellow group members, Katerina and Stelios:
- The tube lines consisting of the stations;
- The station names with the station coordinates;
- The 700,000 + lines of trip data derived from the original TFL data.
A Python script then creates a station index and a station coordinates list, which is then used to create a weighted adjacency matrix of all stations on the network. The scipy.csgraph package is then used to return a solved shortest path array. Subsequently, the data file is imported and the start and ending location for each trip is then resolved against the shortest path results, with the waypoints for each trip written to a new CSV file. A further CSV file containing each station’s name and coordinates is also generated.
Unity Implementation
The Unity implementation consists of several inter-related components. It starts to become complex, but here goes:
- The 3d models for the London landmarks were found in the Sketchup 3D warehouse. Their materials were removed and they were imported to Unity in FBX format;
- The outline for Greater London was prepared as a shapefile by fellow group member, Gianfranco, which he subsequently exported to FBX format via City Engine;
- An empty game object is assigned with the main “Controller” script that provides a springboard to other scripts and regulates the timescale and object instancing throughout the visualisation. This script allows numerous variables to be set via the inspector panel, including the maximum and minimum time scales, the maximum number of non-disabled trip objects permitted at one time (to allow performance fine-tuning for slower computers), a dynamic time scaling parameter, and the assignment of object prefabs for the default DFP and non-DFP trip instances. Further options include a movie-mode with preset camera paths and a demo of station selections;
- One of the challenges in the creation of the visualisation was the need to develop a method for handling time scaling dynamically to reduce computational bottlenecks during rush-hours, and also to speed up the visualisation for the hours between midnight and morning to reduce the duration of time with nothing happening in the visualisation. The Controller script is therefore designed to dynamically manage the time scale;
- The controller script relies on a “FileReader” script to load the CSV files. The stations CSV file is used to instance new station symbols at setup time, each of which, in turn, contains a “LondonTransport” script file, with the purpose of spinning the station symbols. It also sets up behavior so that when a station is clicked, the station name is instanced (“stationText” script) above the station, and trips only to and from that station are then displayed via the Controller script. The FileReader script also reads the main trip data CSV file, and loads all trips at setup time into a dictionary of trip data objects that include the starting and ending station data, as well as the waypoint path earlier generated by the
Pythonscript. The trip data objects are then sorted into a “minute” dictionary that keeps track of which trips are instanced at each point in time. The minute dictionary is in turn used by the Controller script for instancing trip objects. - The “Passenger” and “SelectedPassenger” objects and accompanying scripts are responsible for governing the appearance and behavior of each trip instance. They are kept as simple as possible, since thousands of these scripts can be active at any one point in time, effectively only containing information for setting up the trip interpolation based on Bob Berkebile’s iTween for Unity. iTween is equipped with easing and spline path parameters, thereby simplifying the amount of complexity required for advanced interpolation. The trip instance scripts will destroy the object once it arrives at the destination.
- Other scripts were written for managing the cameras, camera navigation settings, motion paths for the movie mode camera, rotation of the London Eye model, and for setting up the GUI.
Visual and Interaction Design
It was decided to keep the London context minimal with only selected iconic landmarks included for the purpose of providing orientation, and a day-night lighting cycle to give a sense of time. Disabled Freedom Pass journeys consist of a prefab object with a noticeable bright orange trail and particle emitter, in contrast to other trips, which consist of simple prefab objects with a thin white trail renderer and no unnecessarily complex shaders or shadows due to the large quantities of these objects. The trip objects are randomly spaced across four different heights, giving a more accurate depiction of the busyness of a route, as well as a more three-dimensional representation of the flows.
Interactivity is encouraged through the use of keyboard navigation controls for the cameras, as well as a mouse “look around” functionality, switchable cameras, and the ability to take screenshots.