Please note that the following post represents relatively old work: please see my paper on localised mixed-use methods for a more recent overview of mixed-use measures.
Measuring urban land-use diversity
I’ve been exploring ways to map urban land-use diversity, which is a rather tough nut to crack. The problem is that it requires a reliable source of high-quality data that accurately classifies each building occupancy as a type of land use. After some digging around, I learned that the Ordnance Survey’s OS MasterMap Address Layer 2 contains the land-use classification for each address. While no data source is perfect, this is as close to it as it is likely to get.
The land-use classifications are based on the National Land Use Database, which provides not only the major land-use categories - e.g. “residential”, “retail” - but also some important sub-categories, like “Restaurants and Cafes” and, let’s not forget, “Public houses and bars”.
The interesting thing about land-use diversity is that it’s not necessarily something you can “see” when looking at a city’s visible morphology. In other words, if looking at a map of a street, you don’t ordinarily know whether it’s perhaps a row of houses or potentially a more diverse mix that maybe includes a bakery, corner store, daycare, and the like. This is important because by increasing the mix of land-uses, you may end up with a dramatically different street dynamic due to significantly more pedestrian trips.
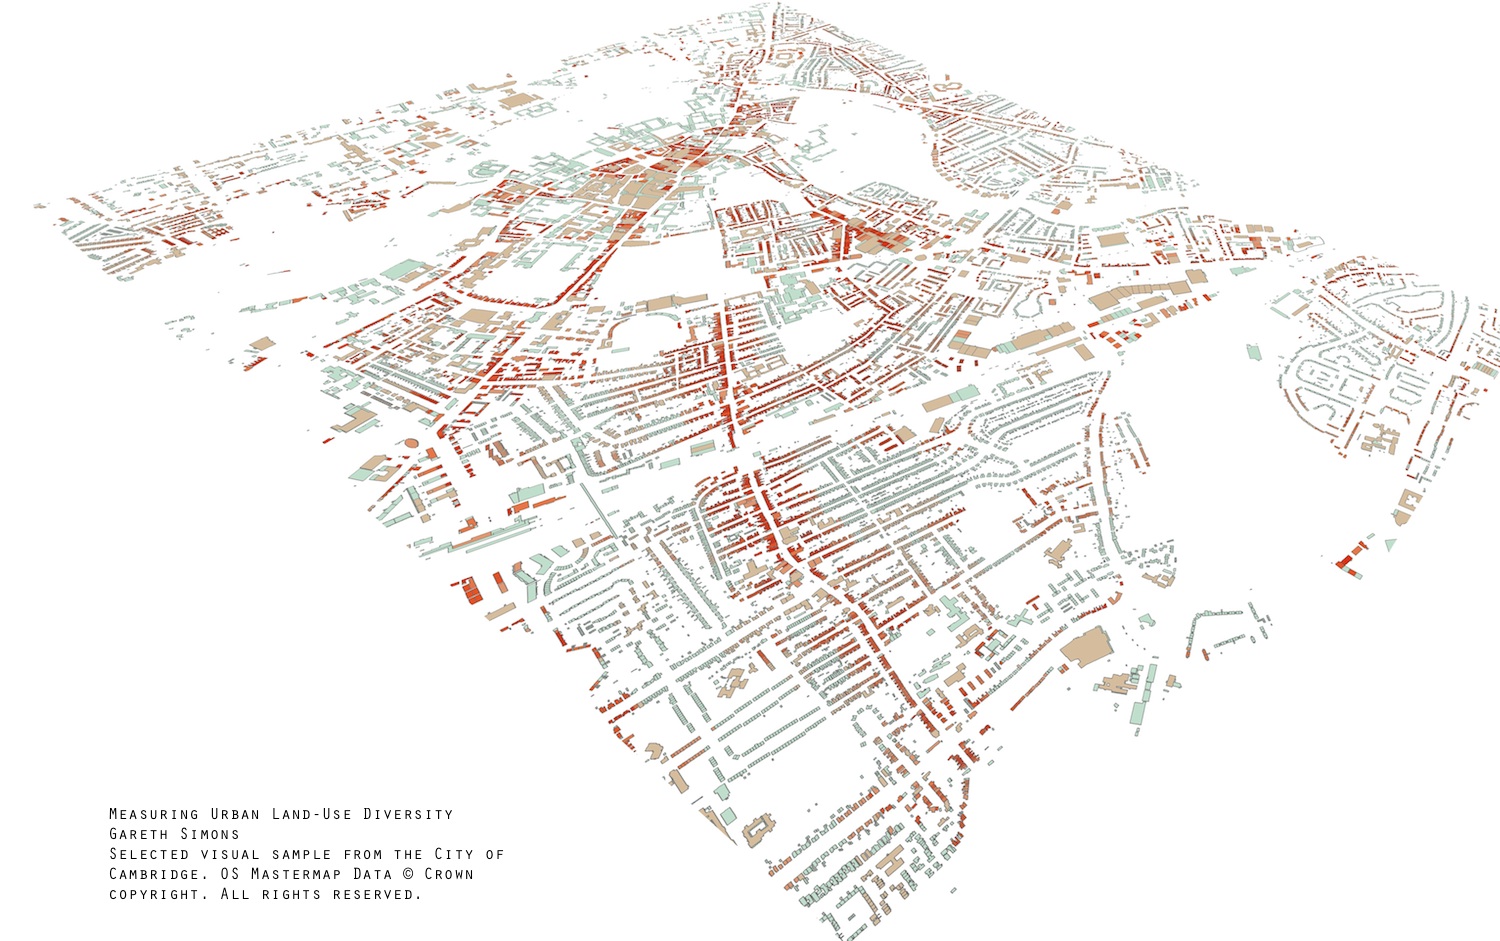
So I’ve created a Python script tool for ArcGIS that can take detailed building type classifications and calculate a spatial diversity index for each building location. It does this by searching for different land-use types within a user-selected distance from each building (based on network path distance) and then calculating a mixed-use index score based on the Gini-Simpson diversity index. It automatically detects the number of land-use “type” categories, which offers some flexibility and specificity on analysing the presence and degree of mixed-uses.
Based on my observations, the tool is accurate in its representation of ‘happening’ and diverse mixed-use areas. But what I’ve found interesting is that surprisingly small search distances seem to work best. This is because they retain the granularity of the results. So, for example, a 50m search distance yields a more useful map than a 250m search distance.
The tool does not distinguish between mixed-use diversity in larger and smaller buildings, which seems counterintuitive when we think of mixed-use diversity in the fine-grained sense described by Jane Jacobs. I’ve resultantly experimented with weighting the results with the inverse of the building’s footprint area, which yields results that focus in on fine-grained mixed-use hubs.
I’ve also taken a look at whether the spatial diversity index results can be used as a weighted input parameter into network analysis tools, such as the Urban Network Analysis toolkit, which calculates centrality based on one of five centrality methods. The benefit of this approach is that it combines urban network analysis with functional mixed-use analysis to reveal those little gems of urban diversity.