Please note that the following post represents relatively old work: please see my paper on localised centrality methods for a more recent overview of centrality measures.
Musings about localised network centrality measures
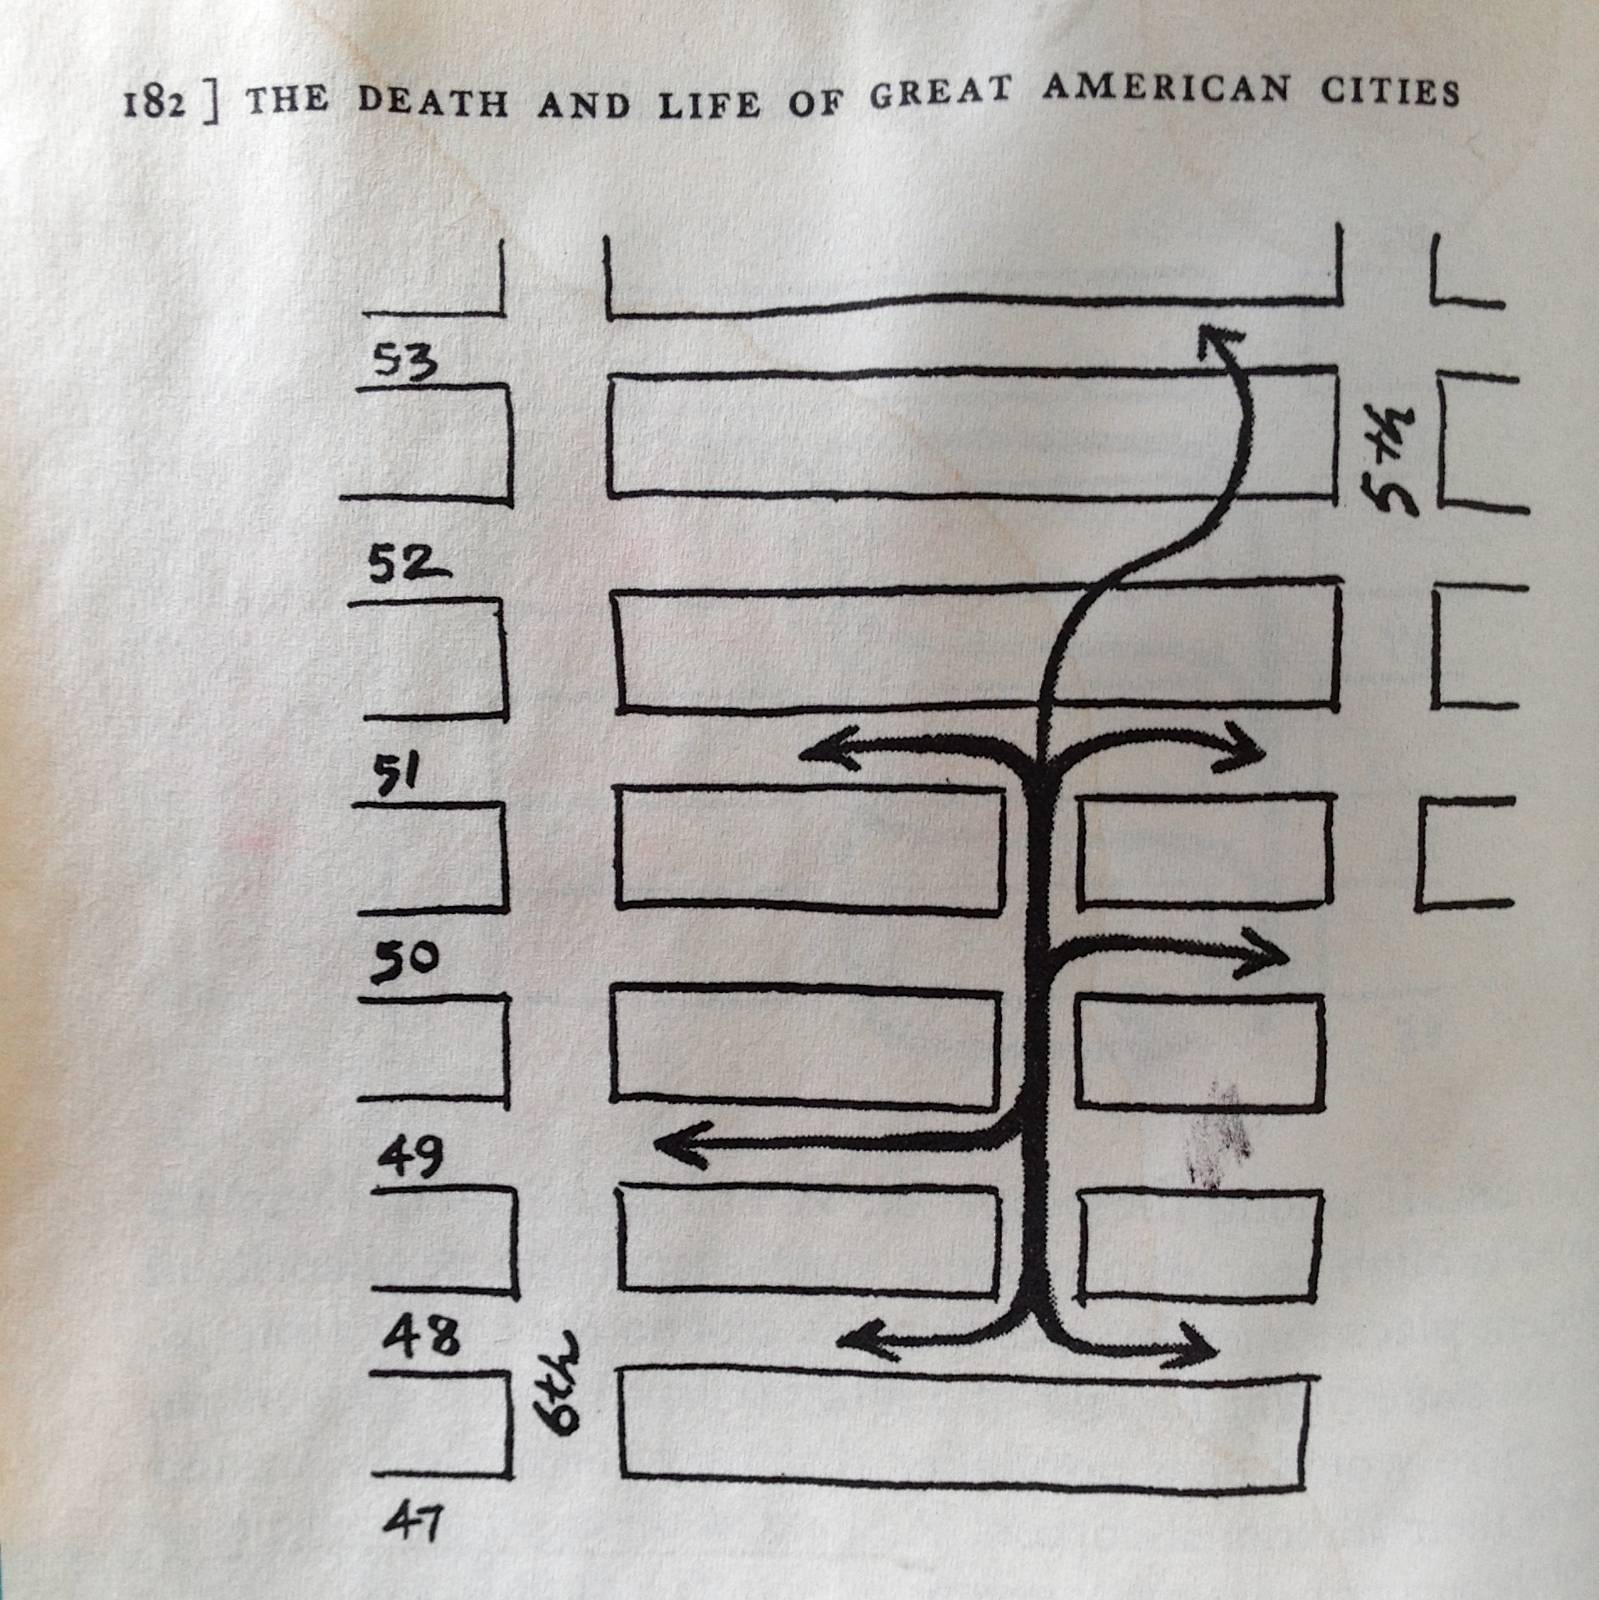
I’ve been running some experiments with graph centrality indices to find an effective method to describe Jane Jacob’s thinking behind her argument for’ the need for small blocks’.
Centrality indices are a manner to identify the most important edges (links) or vertices (nodes) in a graph (network). They can tell you things such as which people are the most influential in a social network or which roads are the most likely to experience traffic and liveliness. In street networks, we are ordinarily dealing with ‘planar’ (flat) graphs consisting of intersections and streets. The graph can be represented in its ‘primal’ form, where the intersections are nodes and the streets are links, or, as is the case with Space Syntax, the graph can be represented in its ‘dual’ form where the streets are represented as nodes. There are also different ways to describe what constitutes a ‘street’, such as traditional implementations of Space Syntax utilising unobstructed lines of sight, i.e. straightness.
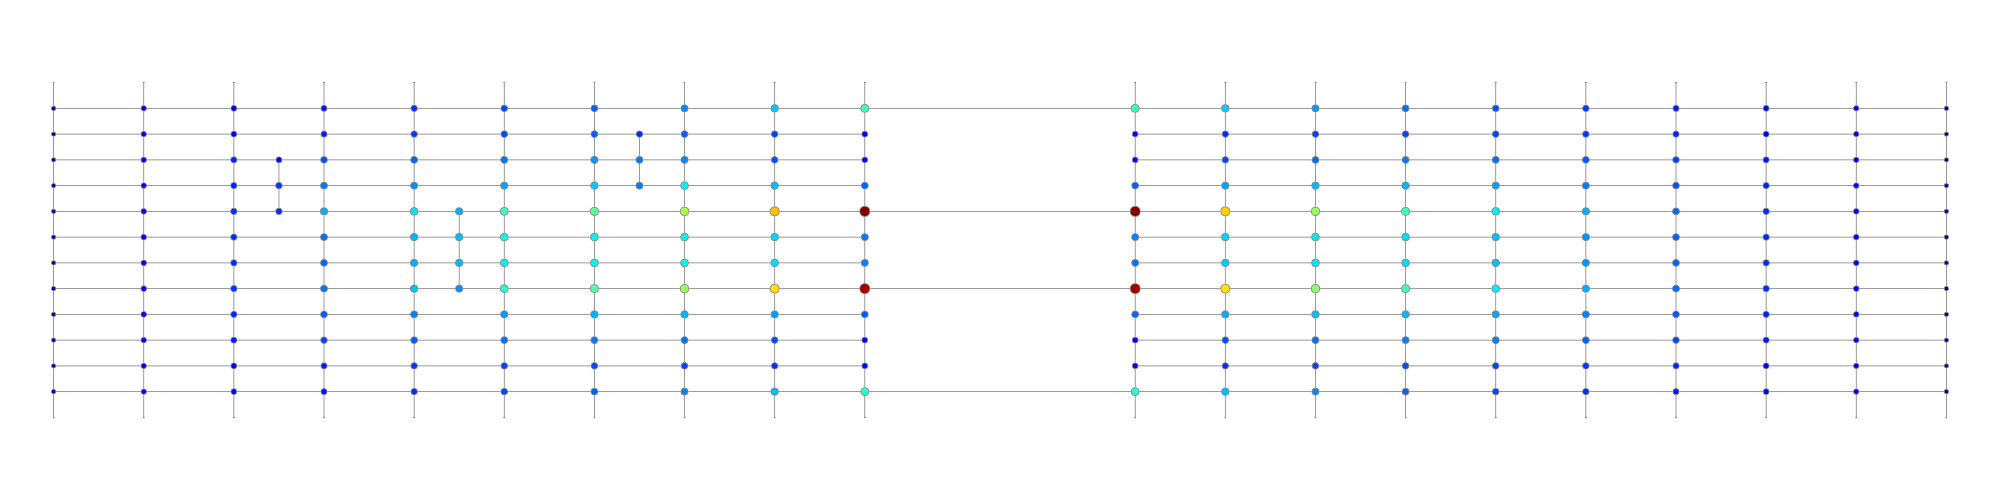
For the sake of intuition and experimentation, I am here using the primal representation where intersections are nodes connected by distance-weighted street links. Since I am trying to zero in on Jacobs’ discussion and examples, I’ve created a little test scenario consisting of two clusters of manhattan grids, asymmetrically connected by longer street segments to sift out what works better at global or local scales. Some of the block clusters also have additional streets at the mid-points of the blocks to identify which centrality indices better align with Jacobs’ discussion about smaller street blocks in the context of her Rockefeller Plaza example (Jacobs 1961).
Some better-known examples of centrality indices include ‘closeness’ centrality, which effectively tells you how close a particular node is to all other nodes, and ‘betweenness’ centrality, which tells you how many times a specific node appears along shortest paths between all other nodes. At first glance, what Jacobs was describing sounds a little bit like betweenness because she mentions how many different paths need to come together to support pools of economic use.
Yet, betweenness doesn’t really tell the whole story. On a global level, betweenness paints an accurate picture of where the most commonly used streets are likely to be, including some isolated and longer streets that are centrally located between all other nodes but that are in some cases unlikely to be successful with pedestrians. However, a different picture emerges with localised betweenness, for which I’ve used a 600m walking radius. An algorithm cycles through all nodes in the graph, figures out which other nodes are within a distance of 600m, and then runs a localised betweenness on the resultant localised networks.
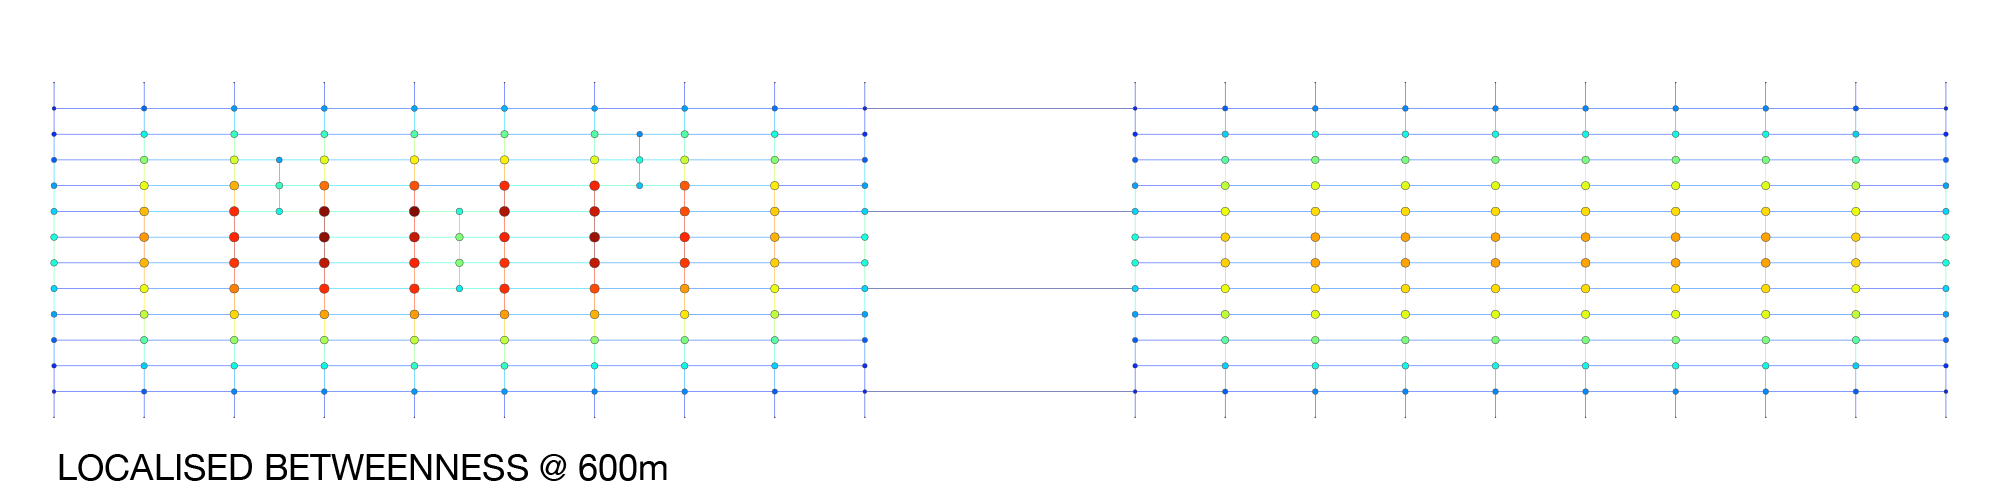
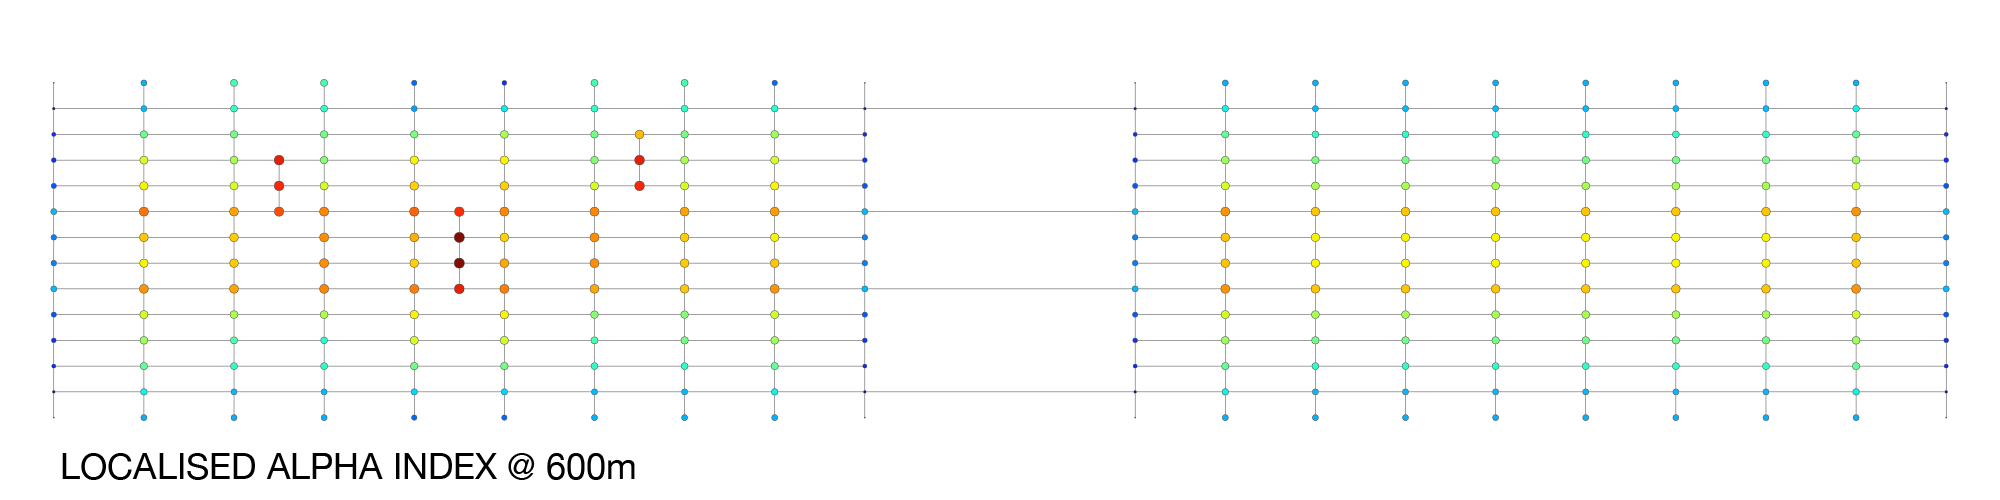
In the above picture, the lower cluster’s results resemble something like a ‘closeness’ centrality. In contrast, the upper cluster shows a similar but slightly higher average score due to the additional origins and destinations. However, the mid-block streets rank pretty low because they aren’t technically on the most direct routes. Looking for a way to better identify these mid-block streets, I then tried Alpha (Meshedness), Beta, and Gamma indices. Amongst these, the measures yield similar results and roughly describe which parts of the graph are more densely connected than other parts. But, while definitely closer to what I’m trying to measure, they demonstrate some peculiarities, such as more centralised nodes scoring lower than less centralised nodes.
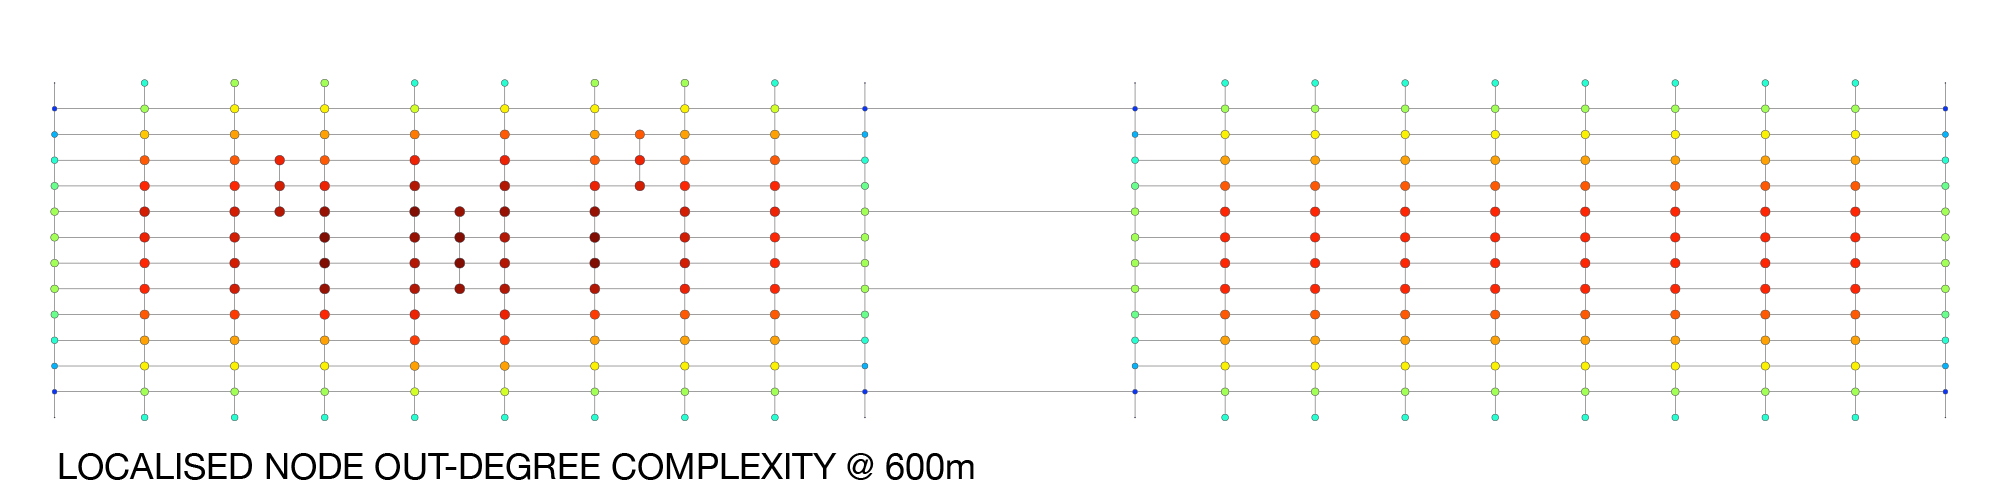
Returning to Jacobs’ argument, what she was describing can be thought of as a form of network porosity and route-choice complexity. In other words, a street network that allows for multiple interweaving route-choice combinations that can support maximal access options to local streets. This is a natural fit for an information entropy measure, so I experimented with a form of (Shannon’s) information entropy to measure the amount of route-choice information in the localised sub-graphs. Without describing the details, the index calculates the information content of the sub-graph’s route choices, assuming all route choices are equally probable.
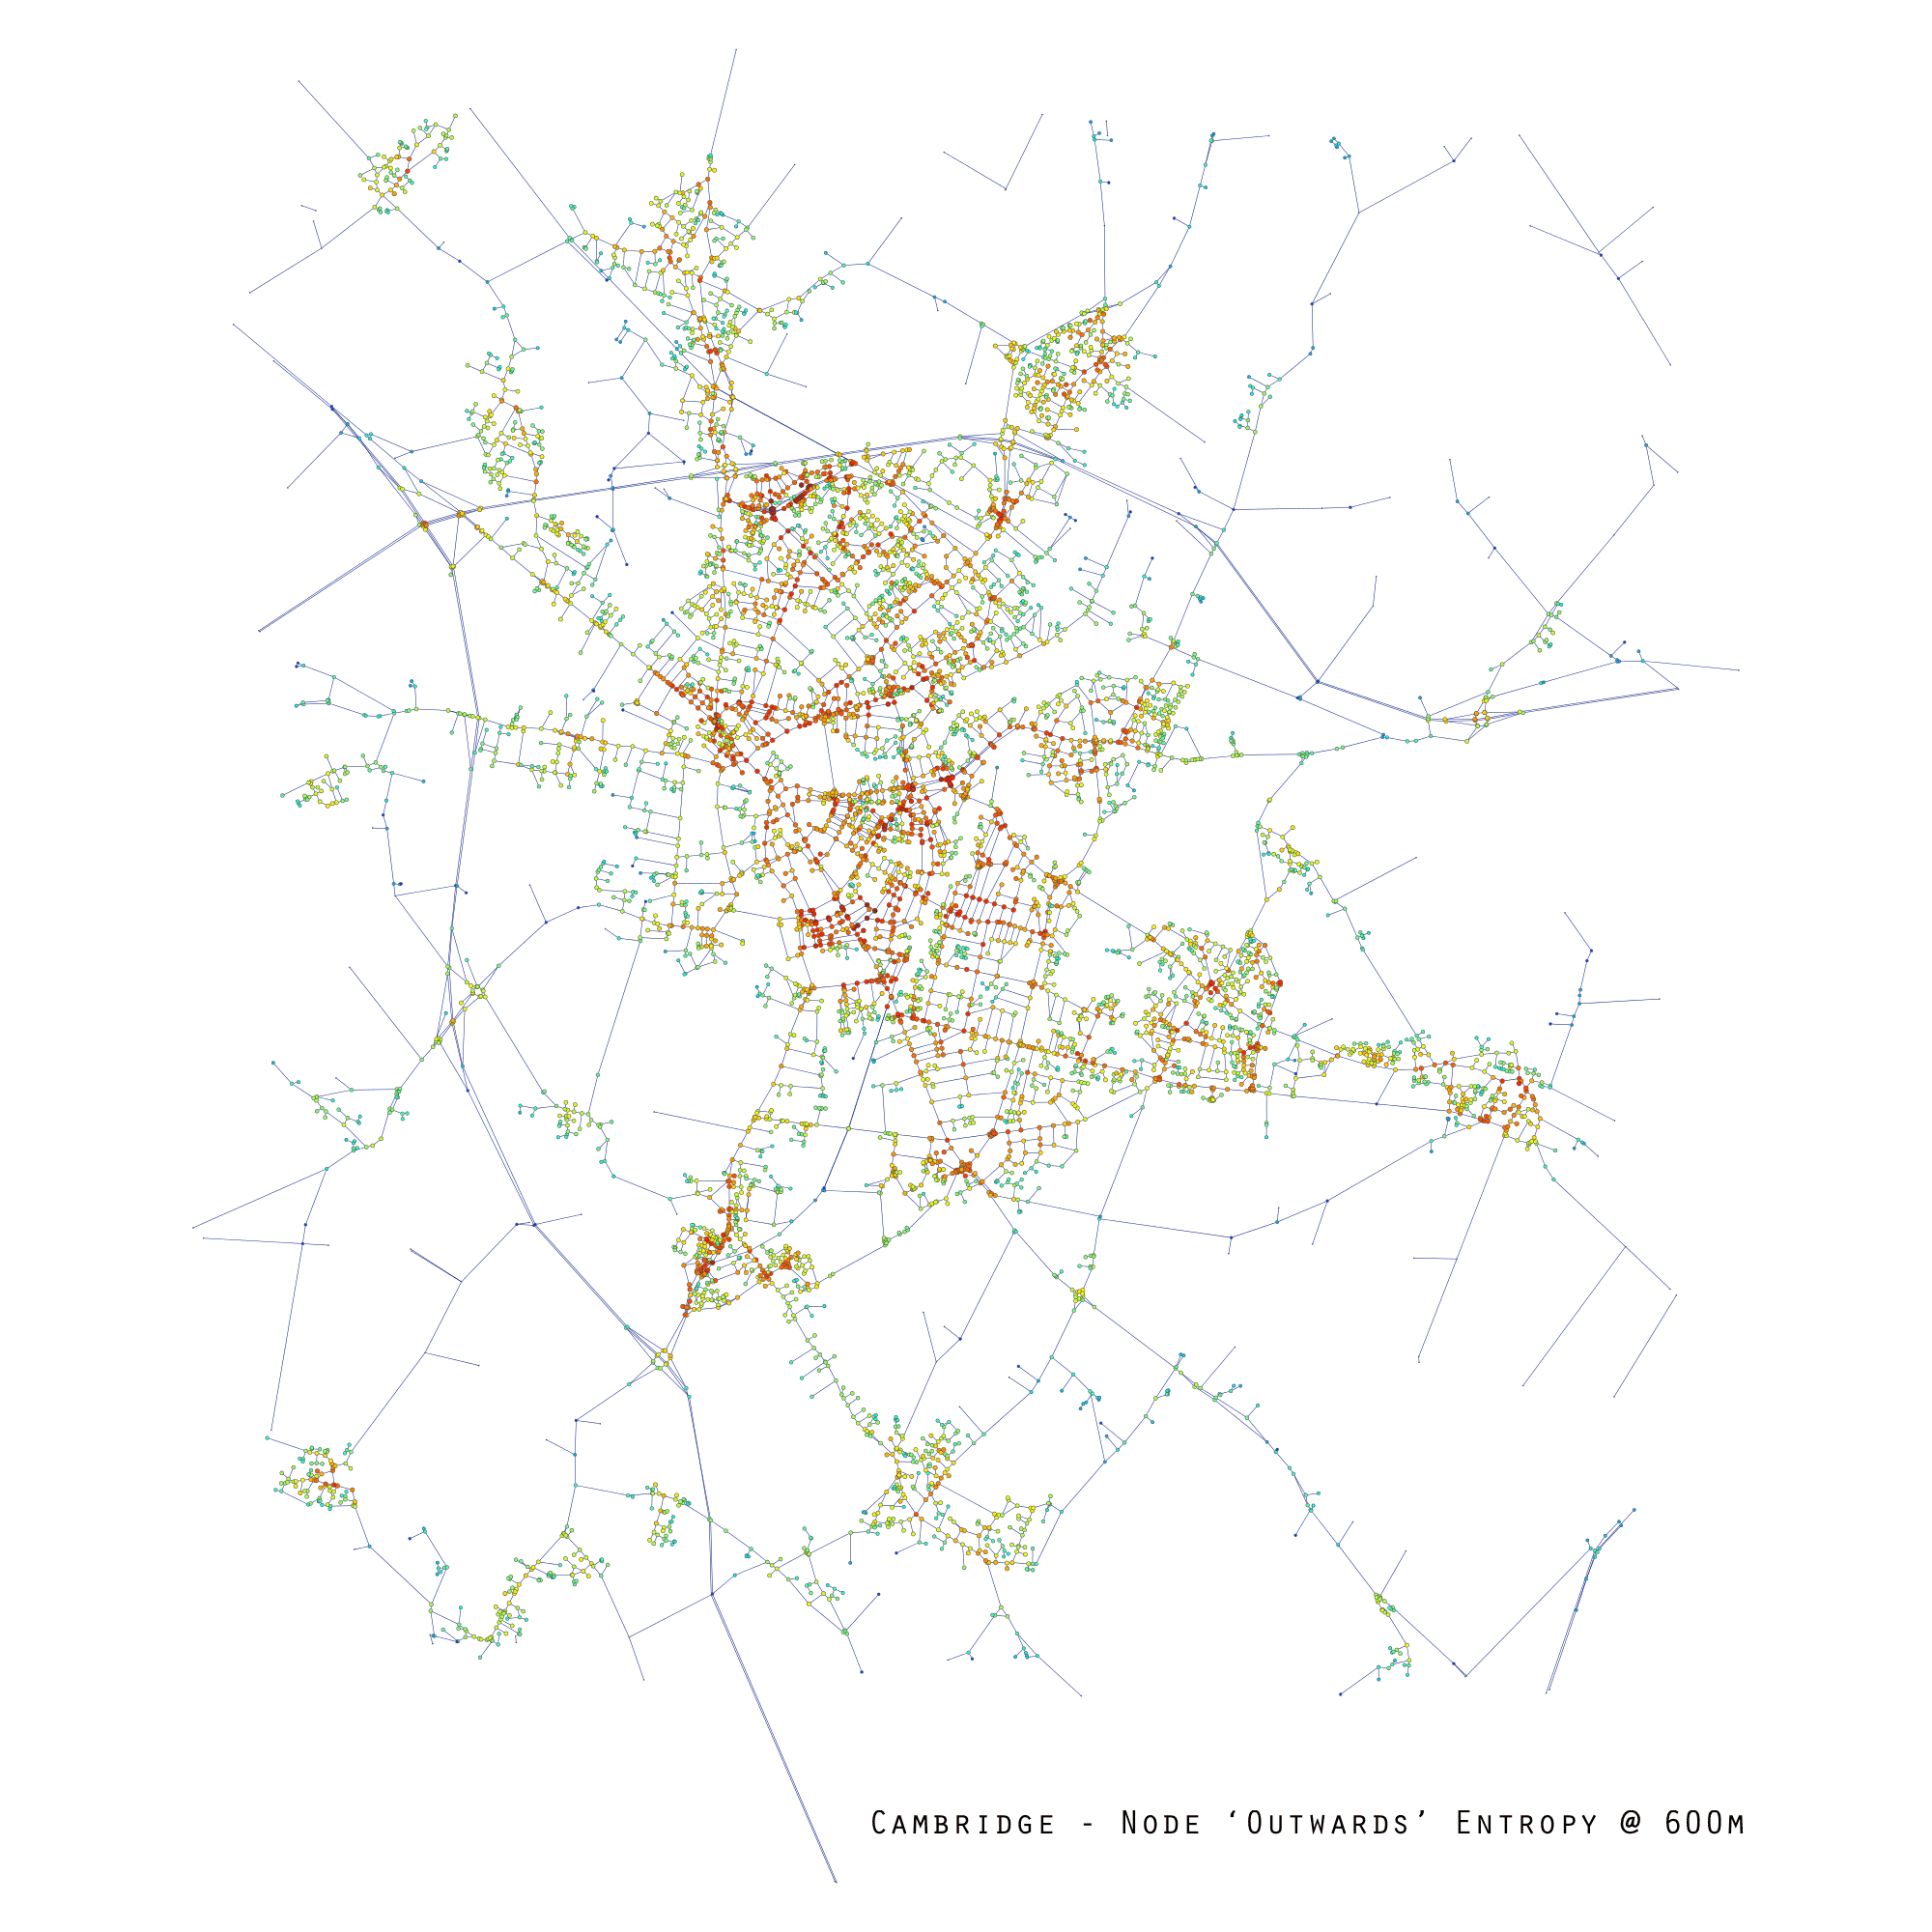
The results are starting to get closer to the notions of porosity and complexity. Still, because this formula is applied to the localised sub-graph in a blanket-like fashion, it doesn’t necessarily encompass some of the routing subtleties of the network emanating outwards from each of the respective nodes. This isn’t immediately obvious in the manhattan-grid test case, but it is subtly present in more varied graphs. I’ve therefore tried another approach, which is to calculate the outwards route choice probabilities (using a breadth-first outwards search) to calculate the number of route choices and their consequent probabilities. This information is then used for computing the node’s information entropy index.
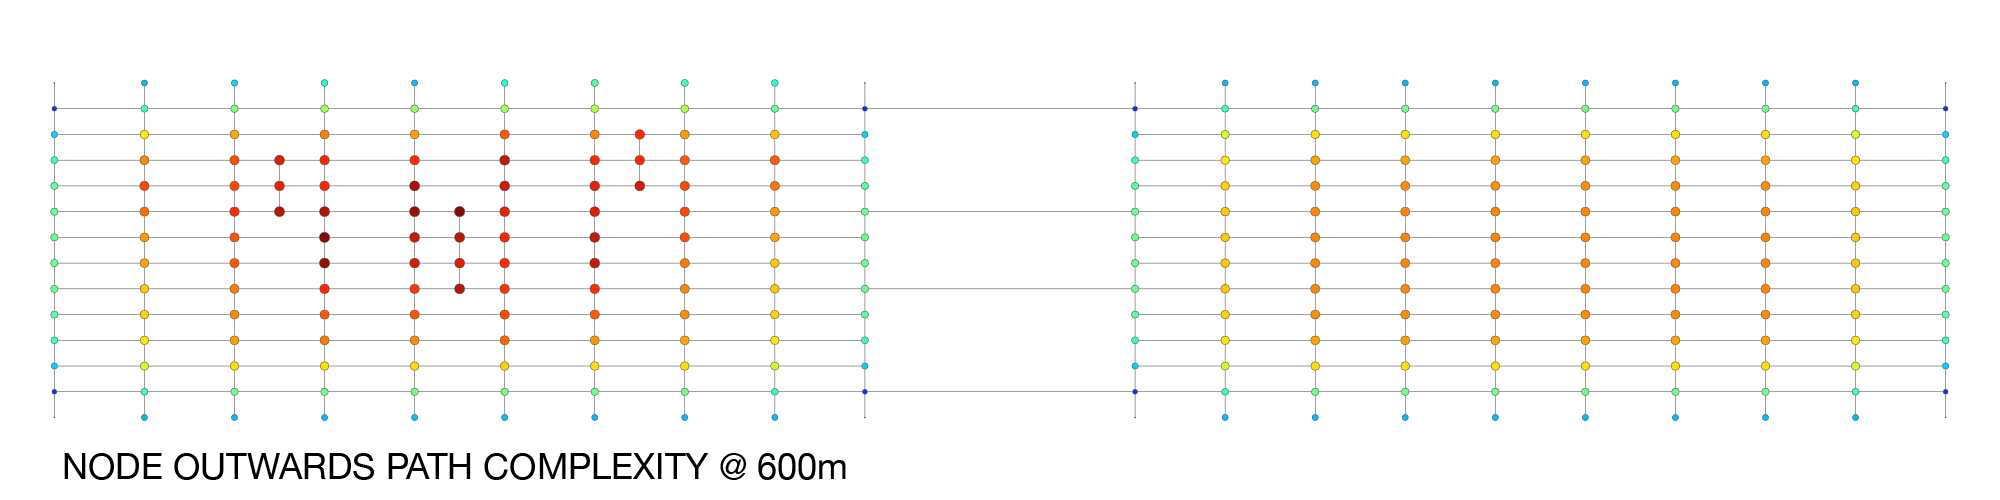
Out of these and several other approaches I tried, this one is my favourite because it results in a granular description of localised route complexity, which identifies the Rockefeller Plaza type of example used by Jacobs. More generally, information entropy is used as the basis of several diversity measures which are used to gauge diversity in systems ranging from economics to ecosystems. So it is perhaps fitting that such indices help describe Jacobs’ conception of diversity as a critical driver in cities as complex systems.