A sidenote on machine-learning accuracies
Predictions with deep neural networks and rich datasets are almost trivial if working with high-quality data and if some form of relationship is recoverable from the given variables. However, specific points are worth considering when working with predictive accuracies, which are misconstruable if not viewed within context. Firstly, it is easy to claim accuracies that would inflate the relevancy of models by using larger distance thresholds. Due to the Modifiable Areal Unit Problem, correlations and predictive accuracies naturally rise for greater distance thresholds. However, in reality, these provide less information about conditions specific to a local scenario. Thus, the challenge is to recover as much accuracy as possible at as small a distance threshold as feasible. Secondly, validation and test sets for machine-learning with spatial data need to consider partitioning on a spatial basis rather than a purely randomised selection of points, such as using a grid to set aside points within cells at specified intervals as a validation or test set. This strategy prevents the model from overfitting by siphoning off information between adjacent points, which would otherwise inflate test-set accuracies. (Visualisation can be a powerful tool for finding hints of overfitting within a spatial context.) Thirdly, whereas straight-forward prediction of a variable via deep neural networks is interesting and valuable in its own right, it can be even more helpful to identify locations where the observed intensities diverge from predicted intensities. Differencing observed from predicted metrics triggers observations in the spirit of Jane Jacobs’ recommendation to look for clues in ‘unaverages’: the local trends or oddities that otherwise seem to defy the model and normative patterns. These peculiarities offer glimpses into pedestrian-scale factors that may otherwise affect the expression of real-life observations and offer a guidepost regarding other considerations that may be beneficial if added to the model. Else, fodder for speculation and discussion around topics that in many cases will remain beyond the realm of the model’s predictive power.
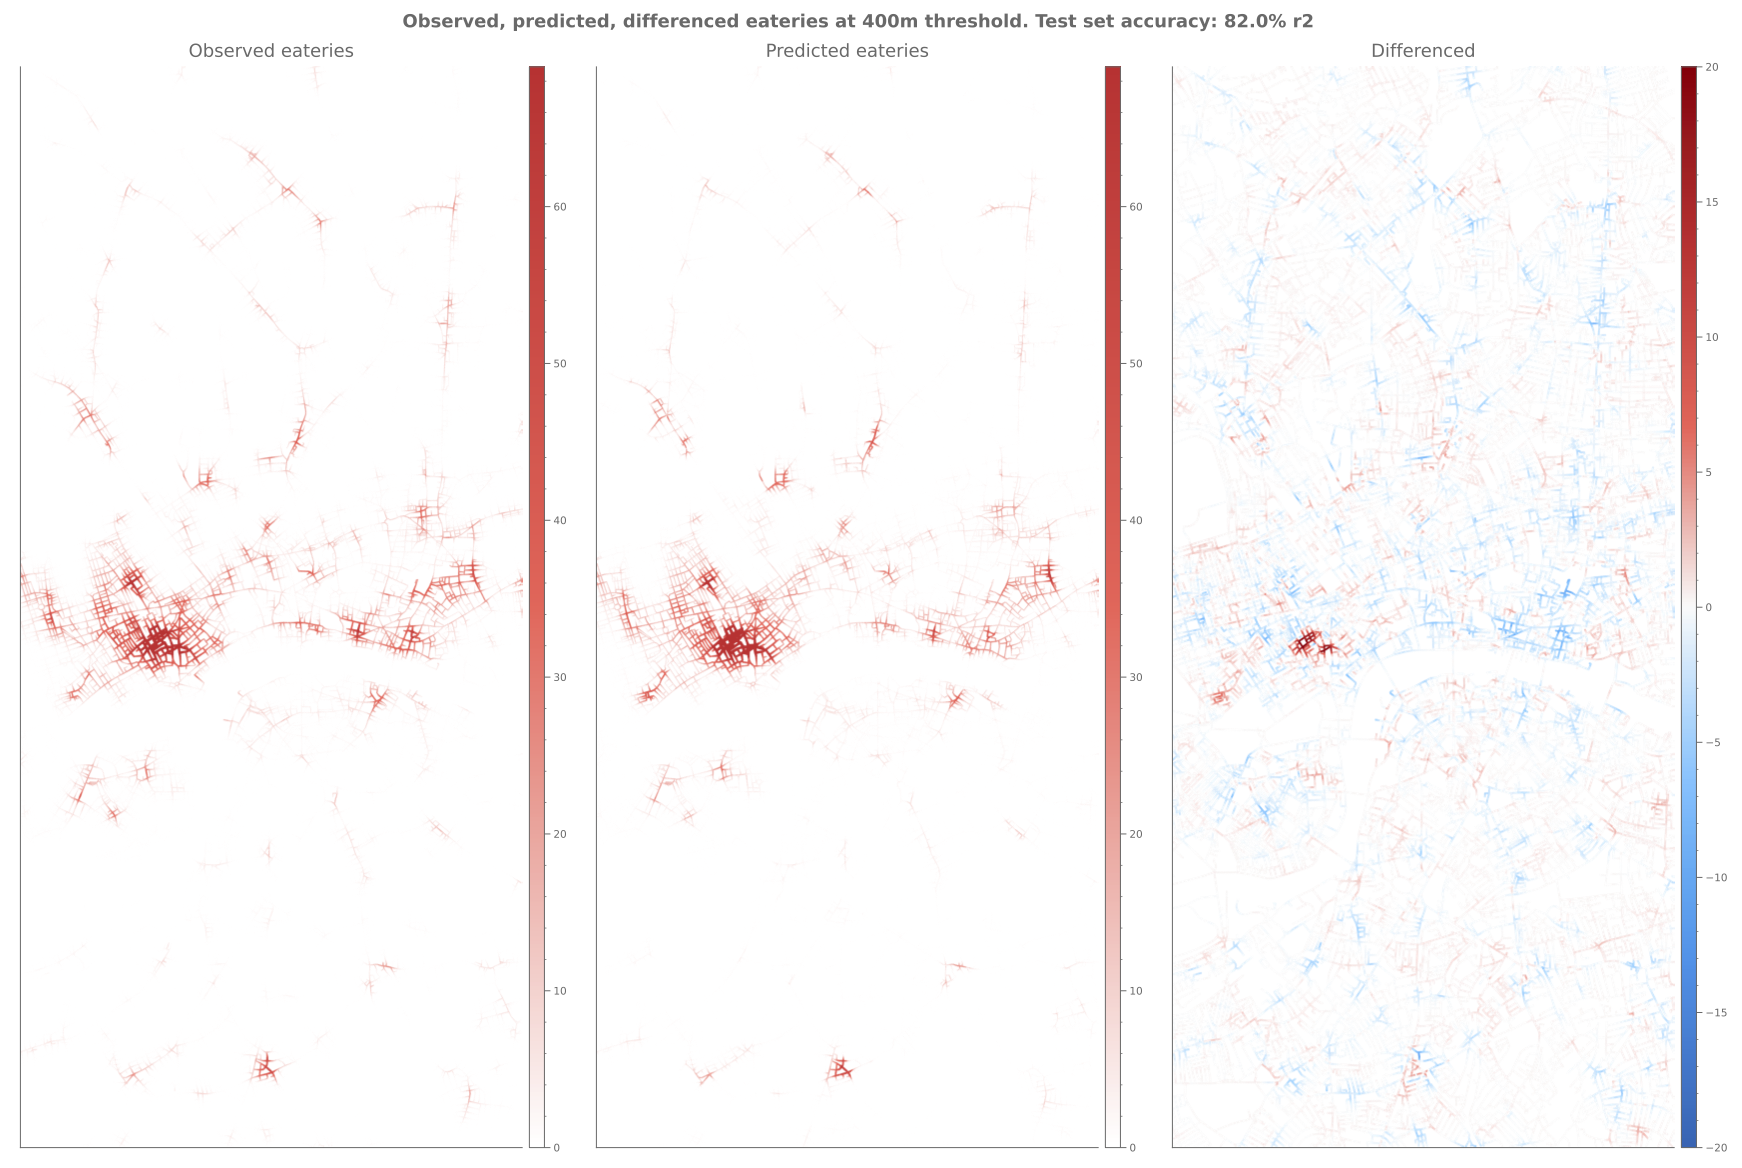 Observed, Predicted, and Differenced intensity of eating establishments at 400m walking tolerances.
By way of example, the above figures shows the observed, predicted, and differenced number of local eating establishments for Greater London using multi-scalar network centralities and population densities as input variables. The differenced plot shows that eating establishments around historical high street locations are slightly underpredicted. It could be surmised that this is due to a lack of information about historic village centres and the related availability of commercial building stock that may otherwise distinguish certain areas of higher betweenness and closeness centralities from others. Another example, locations such as Soho, Seven Dials, and Angel are over-predicted. Here it could be theorised that there may be a latent demand for additional locations, currently unsatisfied due to spatial constraints on the number of viable sites or due to being crowded out by other land-uses such as retail.